Looking for some guidance on how to read and understand the Autoshop Lab and your Google Analytics data? As part of our Monthly Marketing packages, we offer access to the Autoshop Lab, where you can see how your website is working. The Autoshop Lab pulls directly from your Google Analytics data, and simply puts all of your Google Analytics numbers into a form that is easier to read, understand and monitor. These numbers allow you to see how people are interacting with your website, as well as gauge the quality of your website traffic. Below you’ll find information on what exactly you’re looking at, some notable benchmarks, and the importance of reviewing these numbers to ensure quality traffic is being driven to your website.
What do the numbers mean?
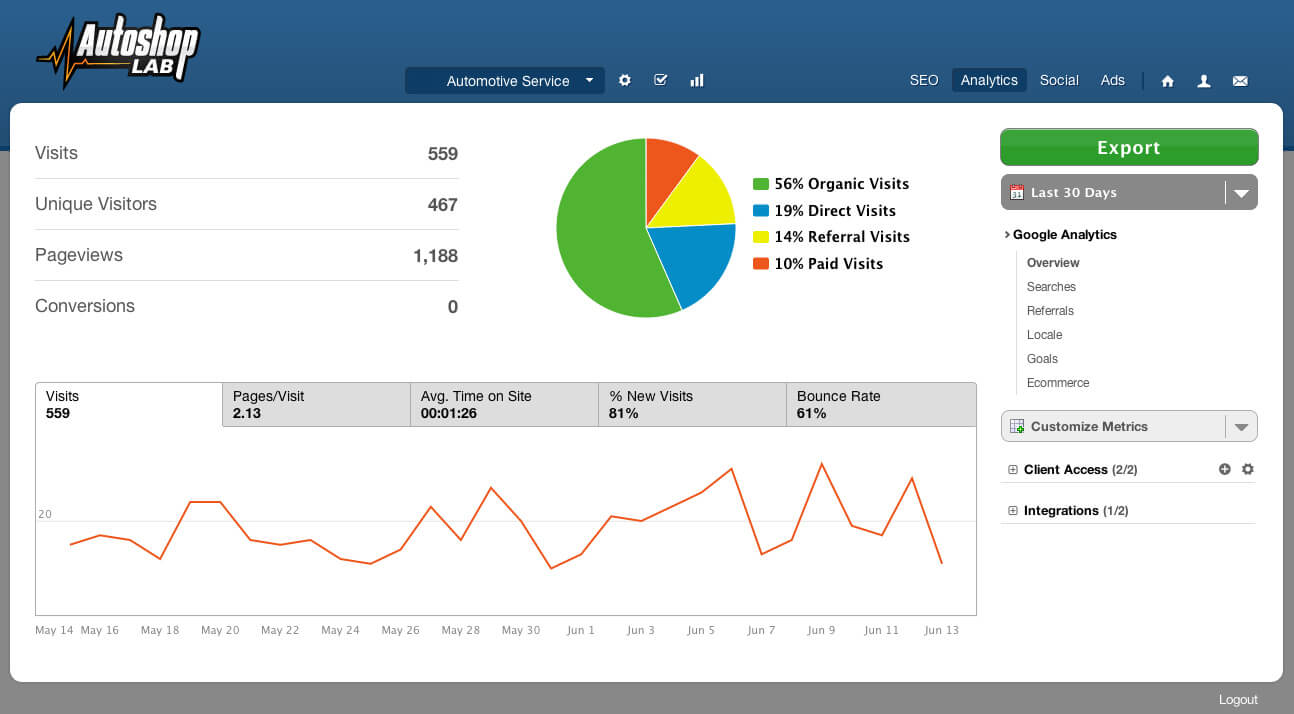
Some of the most important numbers you’ll see in your Autoshop Lab account (and/or your Google Analytics account) are:
1. Unique visitors
2. Time on Site
3. Pages per Visit
4. Bounce Rate
Let’s take a closer look at what the information in these four categories mean and how they can help determine the quality of traffic that’s landing on your auto repair shop website.
1.) Unique Visitors:
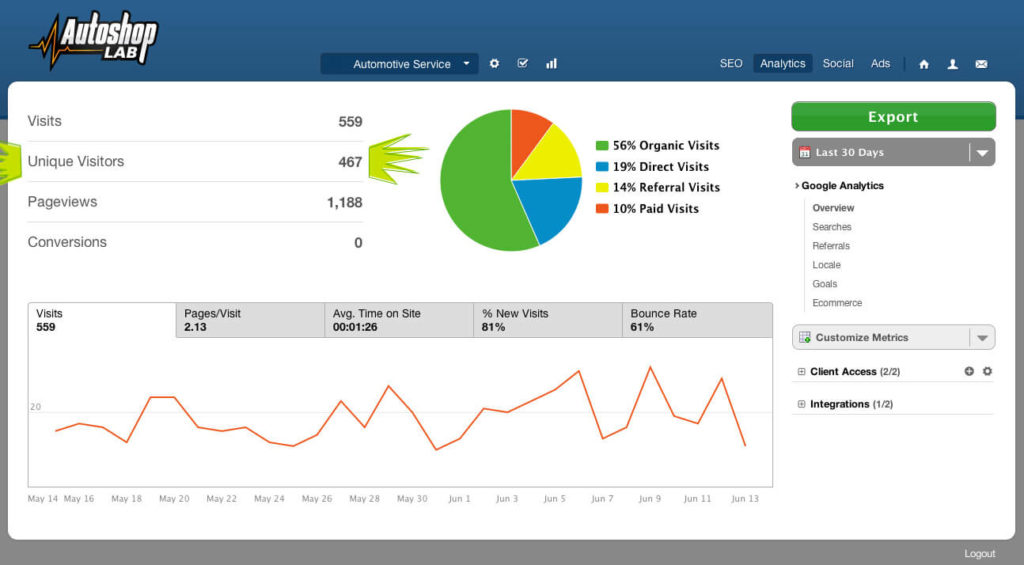
Unique Visitors is the number of individuals that visit your website in any given time period. This means, if I visit your website 3 times this month, I will only show up as one unique visitor for that time period. This number is important, as it gives you an idea of how many people are visiting your website, and excludes visitors that visit your website multiple times each day, week or month (such as yourself!)
2.) Time on Site:
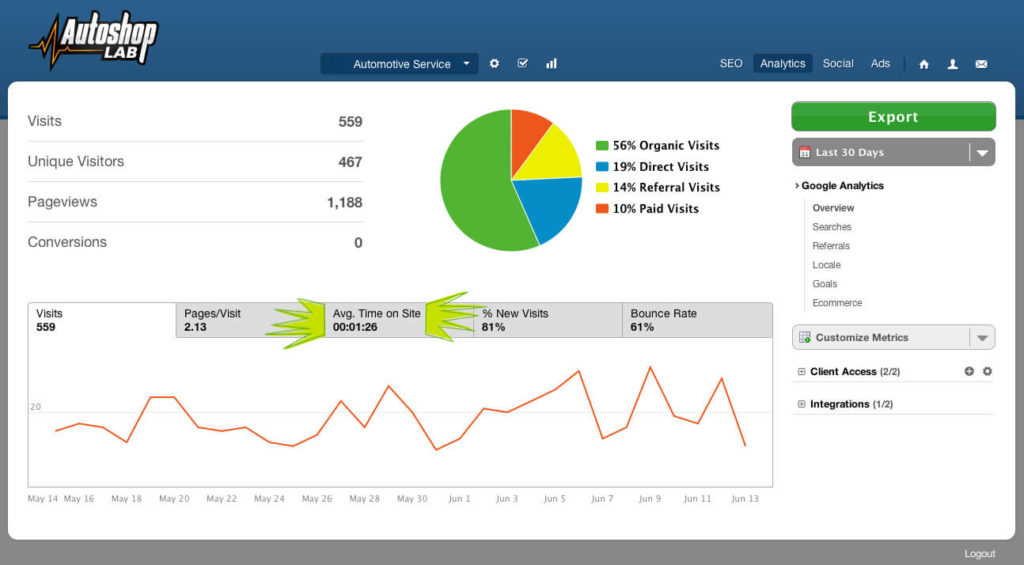
This is the average amount of time visitors are spending on your website. When it comes to Google Analytics for the automotive industry, we’re looking to see that visitors are interacting with your website, but still easily finding the call to action.
If the Time on Site number is too high, it could indicate that people are having a hard time finding the information that they’re looking for ( phone number, address, etc.). If it’s too low, it could indicate that your website isn’t grabbing the interest of its visitors, and possibly leading to a loss in leads. A good benchmark for time on site for local auto repair shops is 1-2 minutes.
There are some instances where this benchmark may vary. If you have multiple location pages on your website, for example, this number may be higher, as visitors might need to direct to a specific location page on the website to find the information that they’re looking for.
3.) Pages per Visit:
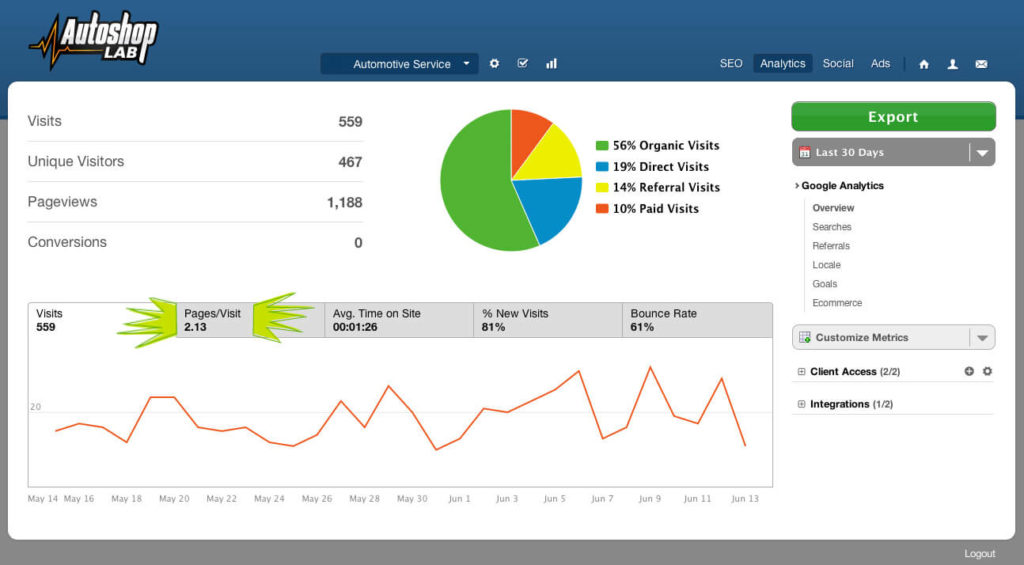
Much like Time on Site, the Pages per Visit number is the average number of pages a visitor is looking at on your website. We like to see some interaction on the website, to ensure that the website is capturing the interest of its audience. For the same reasons noted above, however, we don’t want this number to exceed a certain benchmark, as this could indicate that visitors aren’t finding the information they came there for.
A good benchmark for the Pages per Visit performance indicator for automotive websites is 1.5-2.5 pages. Again, there are instances where this benchmark may vary, but for a general auto repair shop website, we like to see this number within these ranges.
4.) Bounce Rate:
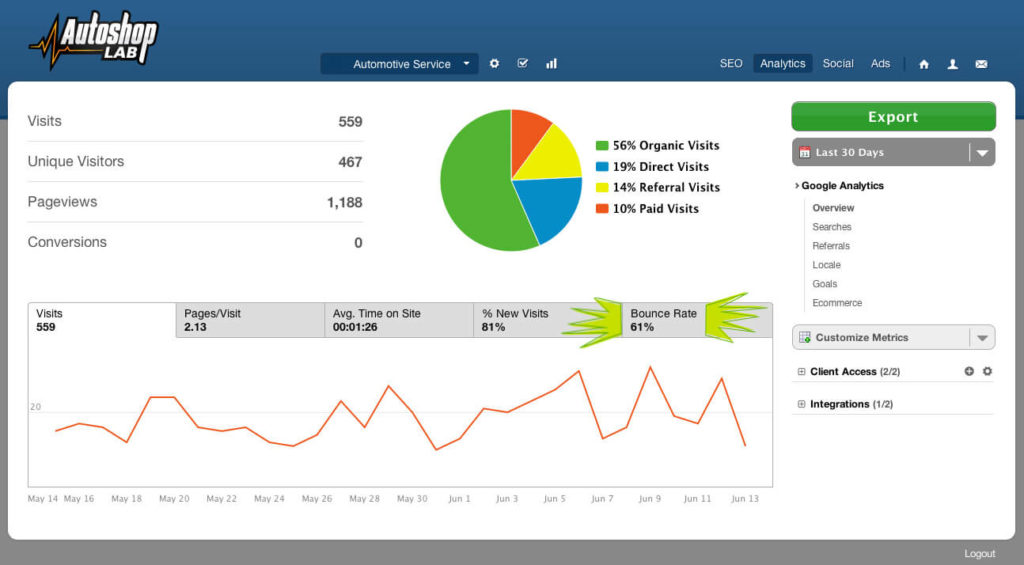
The Bounce Rate is the key performance indicator that confuses the most people.The Bounce Rate is the “percentage of single-page sessions,” or the percentage of visitors who leave the website after viewing only one page. In the auto repair industry, a high bounce rate isn’t necessarily a bad thing, as the goal of your website is to get the phone to ring. If someone lands on your website, reads the information on the homepage and then calls your shop, they are still included as a “bounce” – even though in actuality, they’ve just become a great lead and potential customer!
Since this is the case, a normal range for Bounce Rate on the automotive websites is 40-65%. If we see a percentage lower than 40%, it could indicate that people aren’t finding the information they’re looking for. If we see a bounce rate higher than 65%, it could indicate that your website isn’t grabbing the interest of visitors, and possibly causing a loss in leads. Again, there are instances where this benchmark may vary, but for a general automotive repair shop website, we like to see this number within these ranges.
At Autoshop Solutions, our Marketing Specialists review this Google Analytics data in the Autoshop Lab on an ongoing basis to ensure that your website is performing well and able to drive high quality leads to your shop. You can also learn more about the Autoshop Lab.!
If you’re already and Autoshop Solutions customer and have any questions on these performance indicators, or any other data that you find in the Autoshop Lab, contact one of our Marketing Specialists for assistance in understanding these numbers, we’re always happy to help!
—————————————
You Should Also Read:
![]()
Frequently Asked Questions About
Direct Mail Marketing for Auto Shops

Autoshop Solutions